Server Man
Well-Known Member
- May 17, 2015

- Windows 8.1

- Chrome 66.0.3359.181
Hello to all who are reading. My name is Nathan Gau. I’m a Microsoft Premier Field Engineer and have been supporting System Center Operations Manager (SCOM) for about 4 years now. Most of my blogging is normally SCOM or Cyber Security related, but I wanted to put my platforms hat back on for a bit and talk about SCOM’s event monitoring capabilities along with some of the typical mistakes that windows admins such as myself have made. Not all these tips and tricks are easy to dig up, and while experts in the SCOM world will know most of them; for those of us wearing multiple hats who are occasionally tasked with touching SCOM, we might be in for a bit of a surprise. I know it’s not exciting, but it can be useful.
First to cover some basic capabilities. Most people use SCOM for its alerting capabilities. That is true, and in most environments, it will generate a lot of alerts out of the box. I’m not going to delve into much there, as I’ve done so on my blog, but I wanted to point out that SCOM has the capability to collect and report on events and/or performance data for things such as performance baselining (such as performance before/after major changes to an application) or collecting events that you need to see a frequency for but not necessarily generate alerts. This is a very useful, and often overlooked, component of operations manager.
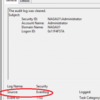
That said, I want to take a deeper dive into how SCOM consumes event logs for monitoring. When one looks at an event log, what we see is the general view designed for human being. SCOM, however, is a robot and prefers looking at the XML. It’s easier to parse, but that also leads to some odd quirks that can have some unexpected results, as you may end up in a scenario where you think you’re monitoring something and are not. The main reason for this is that the values in the XML sometimes differ from that in the friendly view. Take a look at this 4624 event from my lab:


The friendly view defines the Impersonation Level field, while the XML is using a code (%%1832 in this case). While not terribly common, this can happen with certain events. If a rule or monitor was configured to search the log for the “identification” impersonation level, instead of the %%1832, no alert will ever be generated. This can extend to more common features as well:


In this case, the event source differs. This can be very confusing since the source is often something used to filter out event IDs. Again, this isn’t a common occurrence, but I’ve run into it enough that it’s worth mentioning. Again, the values in the XML view are what matters, not the friendly view.
The last thing I wanted to discuss is parameterization. Most events are parameterized, meaning that the event description is effectively broken down into sections. The easy way to search event logs would be to use a common field such as “EventDescription”. SCOM doesn’t give its admins the ability to select this parameter; instead, a SCOM administrator must know this particular parameter by name. There’s a reason for this. Its use is horribly inefficient. It can also be problematic for the SCOM agent, especially if the log being searched happens to be one that fills up rapidly, like say the security log.
Effective use of parameterization allows SCOM to search only the relevant portion of the log. Other than being efficient, it can also reduce noise, which is something that any SCOM admin will have to deal with. You have a couple ways of accomplishing this. Take this 4634 event as an example:

I can search this event by a named parameter, such as TargetUserSid. This is easy enough to do, but it’s also a place where I could easily make a typo and not catch it. For this purpose, SCOM uses numbered parameters. Numbered parameters only apply to the event data, so in the example above, I collapsed the <System> tag since no numbered parameters exist in it. That leaves only the parameters in the event description. The numbering system is straight forward. TargetUserSid is parameter 1. TargetUserName is parameter 2. All you need to do is count to the field you desire and that is the parameter number you need to monitor.
While not exciting information, hopefully I’ve added something useful, as these things can pose issues from time to time.
– Nathan
Continue reading...
First to cover some basic capabilities. Most people use SCOM for its alerting capabilities. That is true, and in most environments, it will generate a lot of alerts out of the box. I’m not going to delve into much there, as I’ve done so on my blog, but I wanted to point out that SCOM has the capability to collect and report on events and/or performance data for things such as performance baselining (such as performance before/after major changes to an application) or collecting events that you need to see a frequency for but not necessarily generate alerts. This is a very useful, and often overlooked, component of operations manager.
That said, I want to take a deeper dive into how SCOM consumes event logs for monitoring. When one looks at an event log, what we see is the general view designed for human being. SCOM, however, is a robot and prefers looking at the XML. It’s easier to parse, but that also leads to some odd quirks that can have some unexpected results, as you may end up in a scenario where you think you’re monitoring something and are not. The main reason for this is that the values in the XML sometimes differ from that in the friendly view. Take a look at this 4624 event from my lab:


The friendly view defines the Impersonation Level field, while the XML is using a code (%%1832 in this case). While not terribly common, this can happen with certain events. If a rule or monitor was configured to search the log for the “identification” impersonation level, instead of the %%1832, no alert will ever be generated. This can extend to more common features as well:


In this case, the event source differs. This can be very confusing since the source is often something used to filter out event IDs. Again, this isn’t a common occurrence, but I’ve run into it enough that it’s worth mentioning. Again, the values in the XML view are what matters, not the friendly view.
The last thing I wanted to discuss is parameterization. Most events are parameterized, meaning that the event description is effectively broken down into sections. The easy way to search event logs would be to use a common field such as “EventDescription”. SCOM doesn’t give its admins the ability to select this parameter; instead, a SCOM administrator must know this particular parameter by name. There’s a reason for this. Its use is horribly inefficient. It can also be problematic for the SCOM agent, especially if the log being searched happens to be one that fills up rapidly, like say the security log.
Effective use of parameterization allows SCOM to search only the relevant portion of the log. Other than being efficient, it can also reduce noise, which is something that any SCOM admin will have to deal with. You have a couple ways of accomplishing this. Take this 4634 event as an example:

I can search this event by a named parameter, such as TargetUserSid. This is easy enough to do, but it’s also a place where I could easily make a typo and not catch it. For this purpose, SCOM uses numbered parameters. Numbered parameters only apply to the event data, so in the example above, I collapsed the <System> tag since no numbered parameters exist in it. That leaves only the parameters in the event description. The numbering system is straight forward. TargetUserSid is parameter 1. TargetUserName is parameter 2. All you need to do is count to the field you desire and that is the parameter number you need to monitor.
While not exciting information, hopefully I’ve added something useful, as these things can pose issues from time to time.
– Nathan
Continue reading...