Memory leaks occur when the JavaScript code of an application retains more and more objects in memory that it doesn’t need any longer instead of releasing them for the browser to garbage collect (GC). For long-running apps, small memory leaks of only a few kilobytes can add up to noticeably degrade performance over time. Web developers who use the React framework know that React maintains a virtualized copy of the DOM. Failing to properly unmount components can potentially lead to an application leaking large parts of the virtual DOM. The Microsoft Edge team is very excited to announce the new Detached Elements tool in Microsoft Edge DevTools. It will help you investigate and resolve DOM memory leaks. This tool, inspired by our friends at Microsoft Teams, has already helped us improve many of our own websites and apps.
View: https://www.youtube.com/watch?v=v2iy17ptmBk
const listOfElements = [];
const divElement = document.querySelector('.my-element-class');
divElement.remove();
listOfElements.push(divElement);
We call this element a detached element. There are valid reasons for detaching elements from the tree. An application might want to remove an element from the view but re-attach it later or in a different place. For example, Twitter detaches and re-attaches tweets as you scroll through the feed. A DOM memory leak occurs when an application keeps references to more and more of these detached elements, without actually reusing them later. As application code grows in size and complexity, it becomes easier to make mistakes and forget to clean things up, which could lead to unknowingly keeping DOM elements in memory. This is particularly a problem for long running applications. Imagine an email client that detaches DOM elements every time an email is opened and closed. If the user keeps the app running for a whole week, this could amount to a really high memory usage which can slow down the entire device over time, especially as the detached elements may carry a lot of data with them.
Let’s investigate a DOM leak
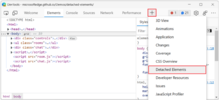
To see how the tool works, we’ll use a demo app that mimics a chat application with messages being added to the UI on a regular basis, and a few rooms to move between.  Let’s open the new Detached Elements panel. We can use the command menu, or click the + button in the toolbar to reveal the list of available tools and select Detached Elements.
  We can now see whether we have detached elements in our demo app. To do this, use the app for a while, generating messages and switching between rooms. Then click Get detached elements. This displays a report with detached elements, if any, as shown below.
 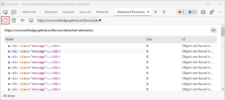 Nodes can sometimes appear detached because they’re not in the DOM anymore, but they can be garbage collected (GC) by the browser at a later time. This is why the tool also comes with a way to force the GC, so make sure you get rid of these nodes by using the Collect garbage button. Our goal isn’t to make sure the list is always empty. Our app may be detaching elements on purpose. But the list of elements should make sense. If the Detached Elements tool reports new nodes are detached after taking an action in the app, then that might mean we are re-creating nodes instead of re-using them.
 It looks like when we switch away from a room, the app detaches all of its messages. We’re also able to verify that this does not seem to be a leak but rather an intentional design. If we go back to Room 2 and then Room 3 again, the detached elements are re-attached to the DOM and appear in the room. We now know rooms keep some messages alive, so they can be reused later. But let’s use another feature of the tool to go further. We’ll use the Analyze feature. Clicking Analyze opens the Memory tool and records a heap snapshot. A heap snapshot displays information about how the memory used by your page is distributed among the JavaScript and DOM objects that it uses, at a specific point in time. By using the Analyze button we’re able to jump straight from a detached node to a specific place in the heap snapshot by clicking on the link in the Id column.
 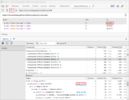 After clicking the Id, the Memory tool scrolls directly to the right line in the heap snapshot and shows the list of retainers. This means that for any detached element, we can know which object in our JavaScript program still refers to it. Let’s click on the room.js link in the Retainers section.
 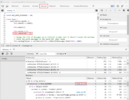 Now we’re in the Sources tool at a line where the unmounted property in class Room retains message elements. Looking at this file in the Sources tool reveals how the unmounted array is used:
hide() {
this.chatEl.querySelectorAll('.message').forEach(el => {
this.unmounted.push(el);
});
this.empty();
}
show() {
this.empty();
this.unmounted.forEach(el => {
this.chatEl.appendChild(el);
});
this.scrollToBottom();
}
What seems to happen here is that when a room is hidden, it collects all of its messages, and pushes them into an array. And when the room is shown again, the messages are appended into the room DOM tree again. This seems to be by design and matches why we were seeing 3 detached elements in the panel before. However, looking at the class some more, we see that the unmounted array is never emptied. If the room gets removed, such as by the user leaving the room, it could cause a leak where messages can never be released from memory. Let’s confirm this by clicking the close buttons on rooms 1 and 2, then getting the detached elements again.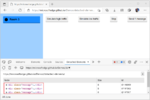 The 3 detached messages are still here, even though the associated rooms have been removed. Now, that is a real DOM memory leak, because those messages will never be reused in the app. Let’s fix this by adding a destroy method to the Room class.
destroy() {
this.unmounted = [];
}
Then call this method when a room is closed. Let’s do the same test again: create messages in rooms 1 and 2, switch to room 3, and close rooms 1 and 2. When we open the Detached Elements tool again, we can confirm that this scenario does not leak DOM nodes anymore!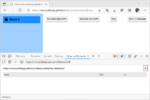 This demo app includes another DOM leak. Try using the Simulate high traffic button for a while, and you should see some detached elements. If you explore the tool, you’ll discover that each room manages a cache of reusable messages. Unfortunately the implementation doesn’t account for race conditions, which end up accumulating more and more DOM nodes.
 You can also read docs about this tool on the Microsoft Edge DevTools documentation. Happy memory leak debugging! – Patrick Brosset, Senior Program Manager, Microsoft Edge
Continue reading...
Detached elements and DOM leaks
Before you try this new tool on your own web content, it’s important to understand some of the nuances between detached elements and DOM leaks. Usually, we create DOM nodes in JavaScript to insert them somewhere in the page to display them. But it is possible to create nodes and never attach them or remove nodes from the page and keep references to them in JavaScript. In this code example, we get a node from the DOM tree, remove it from the tree, and store it in a JavaScript array:const listOfElements = [];
const divElement = document.querySelector('.my-element-class');
divElement.remove();
listOfElements.push(divElement);
We call this element a detached element. There are valid reasons for detaching elements from the tree. An application might want to remove an element from the view but re-attach it later or in a different place. For example, Twitter detaches and re-attaches tweets as you scroll through the feed. A DOM memory leak occurs when an application keeps references to more and more of these detached elements, without actually reusing them later. As application code grows in size and complexity, it becomes easier to make mistakes and forget to clean things up, which could lead to unknowingly keeping DOM elements in memory. This is particularly a problem for long running applications. Imagine an email client that detaches DOM elements every time an email is opened and closed. If the user keeps the app running for a whole week, this could amount to a really high memory usage which can slow down the entire device over time, especially as the detached elements may carry a lot of data with them.
Introducing the Detached Elements tool
To help find and fix DOM memory leaks, the Microsoft Edge team collaborated with Microsoft Teams to build a tool that detects and displays the detached elements on a page. The new Detached Elements panel is available starting with Microsoft Edge 97.Let’s investigate a DOM leak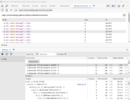
To see how the tool works, we’ll use a demo app that mimics a chat application with messages being added to the UI on a regular basis, and a few rooms to move between.  Let’s open the new Detached Elements panel. We can use the command menu, or click the + button in the toolbar to reveal the list of available tools and select Detached Elements.
  We can now see whether we have detached elements in our demo app. To do this, use the app for a while, generating messages and switching between rooms. Then click Get detached elements. This displays a report with detached elements, if any, as shown below.
  Nodes can sometimes appear detached because they’re not in the DOM anymore, but they can be garbage collected (GC) by the browser at a later time. This is why the tool also comes with a way to force the GC, so make sure you get rid of these nodes by using the Collect garbage button. Our goal isn’t to make sure the list is always empty. Our app may be detaching elements on purpose. But the list of elements should make sense. If the Detached Elements tool reports new nodes are detached after taking an action in the app, then that might mean we are re-creating nodes instead of re-using them.
Switching rooms
To make DOM leaks in our demo app easier to investigate, let’s focus on a simple test. We’ll look at how switching between rooms affects detached elements:- Go to Room 1 and generate a couple of messages.
- Switch to Room 2 and generate another message.
- Switch to Room 3.
- Get the list of detached elements.
 It looks like when we switch away from a room, the app detaches all of its messages. We’re also able to verify that this does not seem to be a leak but rather an intentional design. If we go back to Room 2 and then Room 3 again, the detached elements are re-attached to the DOM and appear in the room. We now know rooms keep some messages alive, so they can be reused later. But let’s use another feature of the tool to go further. We’ll use the Analyze feature. Clicking Analyze opens the Memory tool and records a heap snapshot. A heap snapshot displays information about how the memory used by your page is distributed among the JavaScript and DOM objects that it uses, at a specific point in time. By using the Analyze button we’re able to jump straight from a detached node to a specific place in the heap snapshot by clicking on the link in the Id column.
  After clicking the Id, the Memory tool scrolls directly to the right line in the heap snapshot and shows the list of retainers. This means that for any detached element, we can know which object in our JavaScript program still refers to it. Let’s click on the room.js link in the Retainers section.
  Now we’re in the Sources tool at a line where the unmounted property in class Room retains message elements. Looking at this file in the Sources tool reveals how the unmounted array is used:
 hide() {
this.chatEl.querySelectorAll('.message').forEach(el => {
this.unmounted.push(el);
});
this.empty();
}
show() {
this.empty();
this.unmounted.forEach(el => {
this.chatEl.appendChild(el);
});
this.scrollToBottom();
}
What seems to happen here is that when a room is hidden, it collects all of its messages, and pushes them into an array. And when the room is shown again, the messages are appended into the room DOM tree again. This seems to be by design and matches why we were seeing 3 detached elements in the panel before. However, looking at the class some more, we see that the unmounted array is never emptied. If the room gets removed, such as by the user leaving the room, it could cause a leak where messages can never be released from memory. Let’s confirm this by clicking the close buttons on rooms 1 and 2, then getting the detached elements again.
 The 3 detached messages are still here, even though the associated rooms have been removed. Now, that is a real DOM memory leak, because those messages will never be reused in the app. Let’s fix this by adding a destroy method to the Room class.
 destroy() {
this.unmounted = [];
}
Then call this method when a room is closed. Let’s do the same test again: create messages in rooms 1 and 2, switch to room 3, and close rooms 1 and 2. When we open the Detached Elements tool again, we can confirm that this scenario does not leak DOM nodes anymore!
 This demo app includes another DOM leak. Try using the Simulate high traffic button for a while, and you should see some detached elements. If you explore the tool, you’ll discover that each room manages a cache of reusable messages. Unfortunately the implementation doesn’t account for race conditions, which end up accumulating more and more DOM nodes.
Try it out and let us know what you think
This demo app and leaks are artificial. You should try the tool on real production apps to see if you can find potential problems. We would love to hear what you think of the Detached Elements tool. Any feedback is more than welcome. You can get in touch with the DevTools team simply by clicking the feedback button in DevTools or tweeting @EdgeDevTools! You can also read docs about this tool on the Microsoft Edge DevTools documentation. Happy memory leak debugging! – Patrick Brosset, Senior Program Manager, Microsoft Edge
Continue reading...